Home help
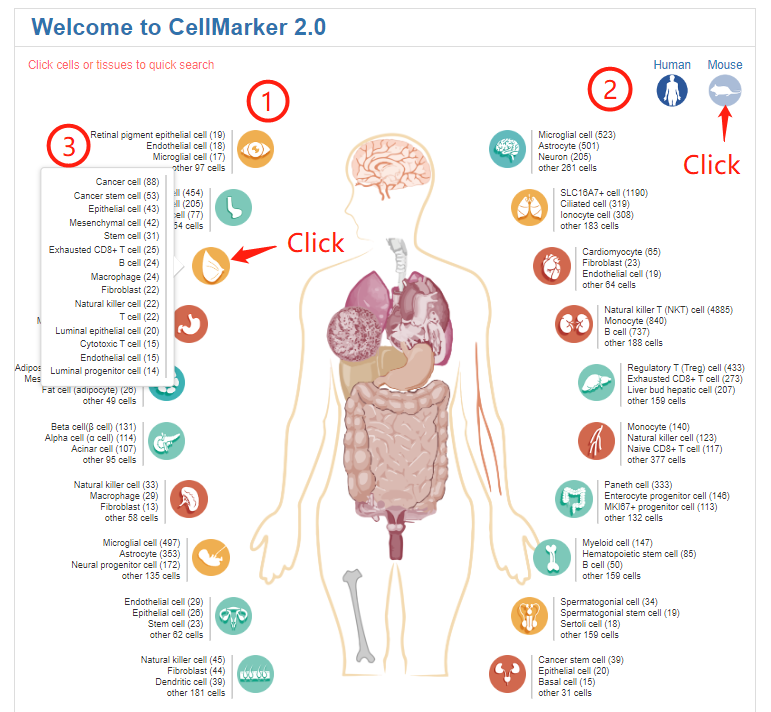
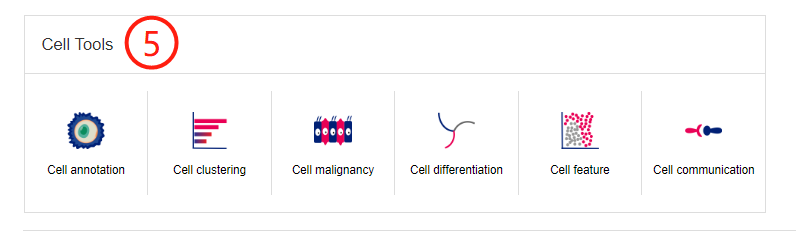
The home page provides a global view of body maps of human and mouse to quickly explore cell markers by clicking on hyperlinks embedded in the web images - 'Anatomical location of human or mouse cells' (1). The mouse body map can be switched by clicking the icon at the top right (2). The body maps can facilitate quick browse of cell markers for the listed cell types and more detailed cell types can be shown by clicking the tissue icons (3). When click a cell type, it will jump to the corresponding search result of the cell markers related to the cell type (4). Click to use the six web tools in Cell Tools (5).

On the right side of the home page is a quick search box. Users can search cell markers by inputting cell name, cell marker name, or tissue name of interest.

Search and Result help
Users can query the database through three search panels: Cell Search, Marker Search and Quick search.
Cell search help
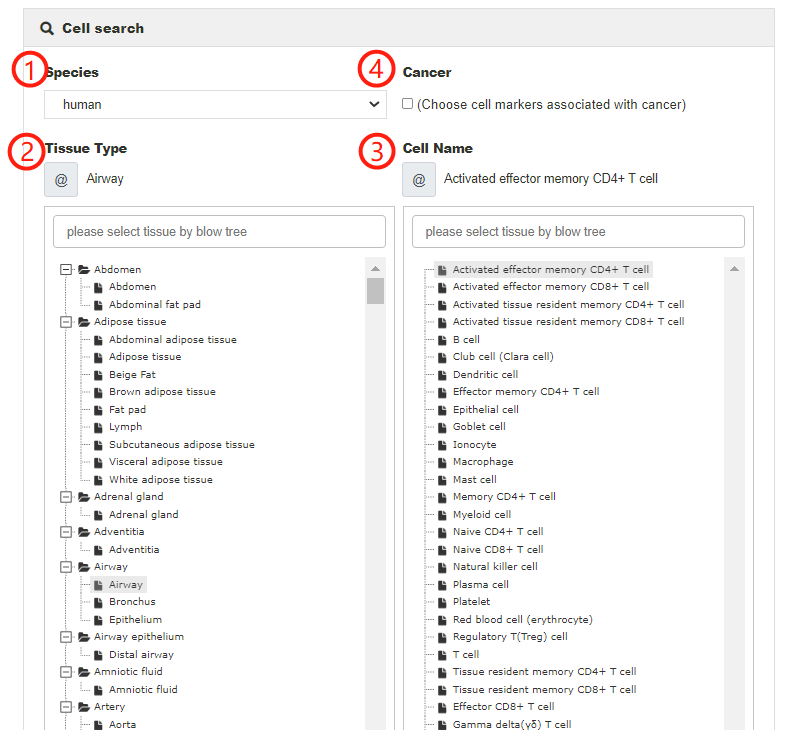
Users can search for cell markers of cells of interest by selecting species from the pull-down menu, tissue type from the hierarchical tree of tissues and cell type from the hierarchical trees of cell types (1-3). When input key words into corresponding search box, the candidate tissues or cells stored in the database will be listed for further selection. In particular, cell markers associated with cancers in the corresponding tissue will be returned if choosing the 'Cancer' box (4).
Here, we take 'Activated effector memory CD4+ T cell' as an example to explain how to search cell markers in a particular cell. First, choose 'Human' in the 'Species type' search box (1). Next, choose the 'Airway' in the 'Tissue type' box (2) and then input or choose ' Activated effector memory CD4+ T cell' in the 'Cell type' box (3). After clicking on the 'Submit' button, the Result page is displayed.
Result help
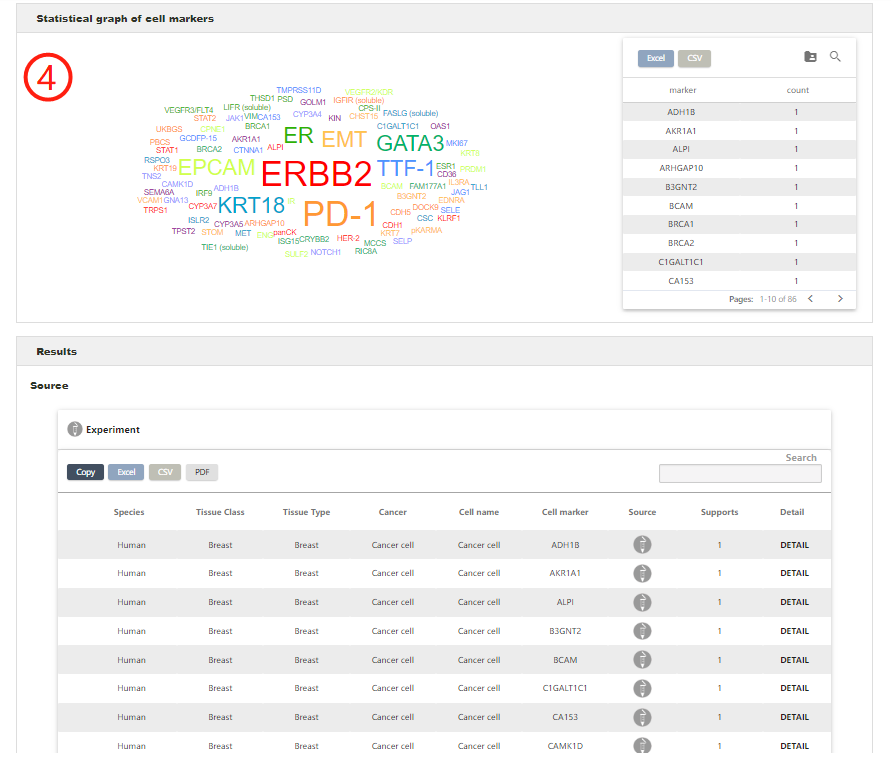
The result page contains an intuitive statistical graph of cell marker prevalence and each marker in the graph can be clicked to search (1), which is quantified by the number of supportive evidence (i.e., publications) and an integrative cell marker list for the queried cell type (2). The detail data can be downloaded by the download icon. Also, the Result page displays four detailed tables of cell marker entries derived from different sources including single-cell RNA sequencing, experiment, review and company. Each entry contains Species, Tissue class, Tissue type, Cancer, Cell name, Cell Marker, Source and Supports (3). By clicking on the hyperlink 'DETAIL' for an individual entry in these tables, users can obtain more detailed information including Gene symbols, Gene ids, Gene names, Uniport ids, publication information (i.e., title, PubMed ID, journal and publication year) and the cross references to external databases (4). In addition, CellMarker2.0 provides several features for browsing the query results. Users can filter entries by typing terms in the 'Search' box at the top right of the table, sort columns in an ascending (or a descending) fashion by clicking the arrows in the column headers.
The result page contains an intuitive statistical graph of cell marker prevalence and each marker in the graph can be clicked to search (1), which is quantified by the number of supportive evidence (i.e., publications) and an integrative cell marker list for the queried cell type (2). The detail data can be downloaded by the download icon. Also, the Result page displays four detailed tables of cell marker entries derived from different sources including single-cell RNA sequencing, experiment, review and company. Each entry contains Species, Tissue class, Tissue type, Cancer, Cell name, Cell Marker, Source and Supports (3). By clicking on the hyperlink 'DETAIL' for an individual entry in these tables, users can obtain more detailed information including Gene symbols, Gene ids, Gene names, Uniport ids, publication information (i.e., title, PubMed ID, journal and publication year) and the cross references to external databases (4). In addition, CellMarker2.0 provides several features for browsing the query results. Users can filter entries by typing terms in the 'Search' box at the top right of the table, sort columns in an ascending (or a descending) fashion by clicking the arrows in the column headers.

Marker search help
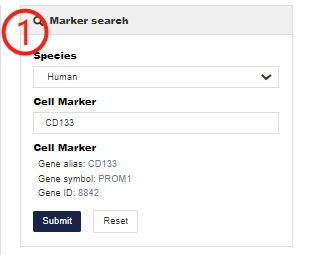
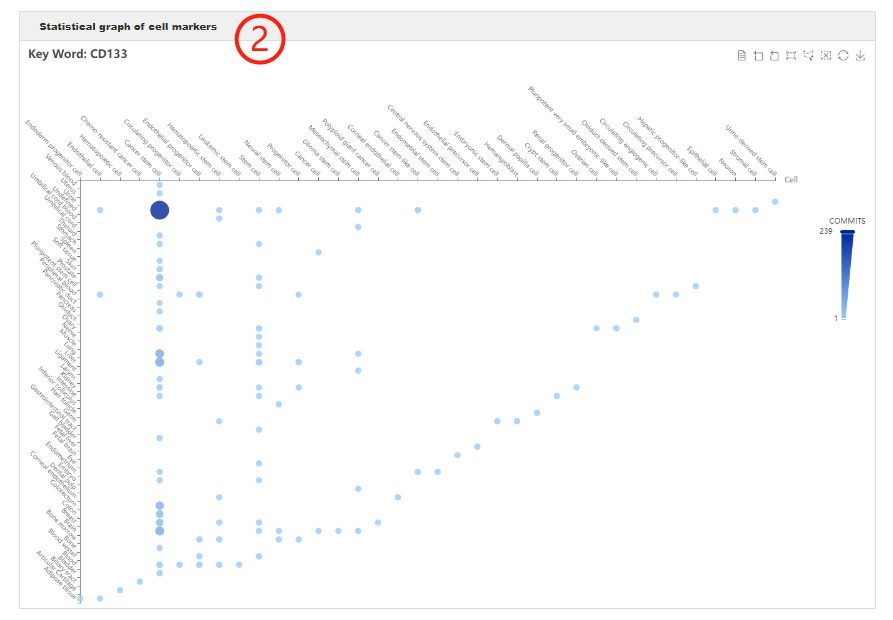
Users can search any genes of interest by entering gene symbols, gene idsorgene names to query in which cell types of which tissues the specific gene can act as cell marker (1). After clicking the 'Submit' button, the search engine will return an interactive bubble chart and a table showing comprehensive information of cell markers (2-3). The interactive bubble chart exhibits how often the gene of interest is used as a cell marker in different cells of different tissues.
Users can search any genes of interest by entering gene symbols, gene idsorgene names to query in which cell types of which tissues the specific gene can act as cell marker (1). After clicking the 'Submit' button, the search engine will return an interactive bubble chart and a table showing comprehensive information of cell markers (2-3). The interactive bubble chart exhibits how often the gene of interest is used as a cell marker in different cells of different tissues.

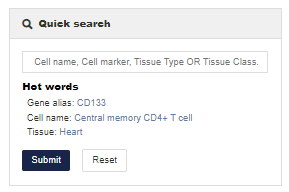
Quick search help
Users can also use “Quick search” in the “Search” section.
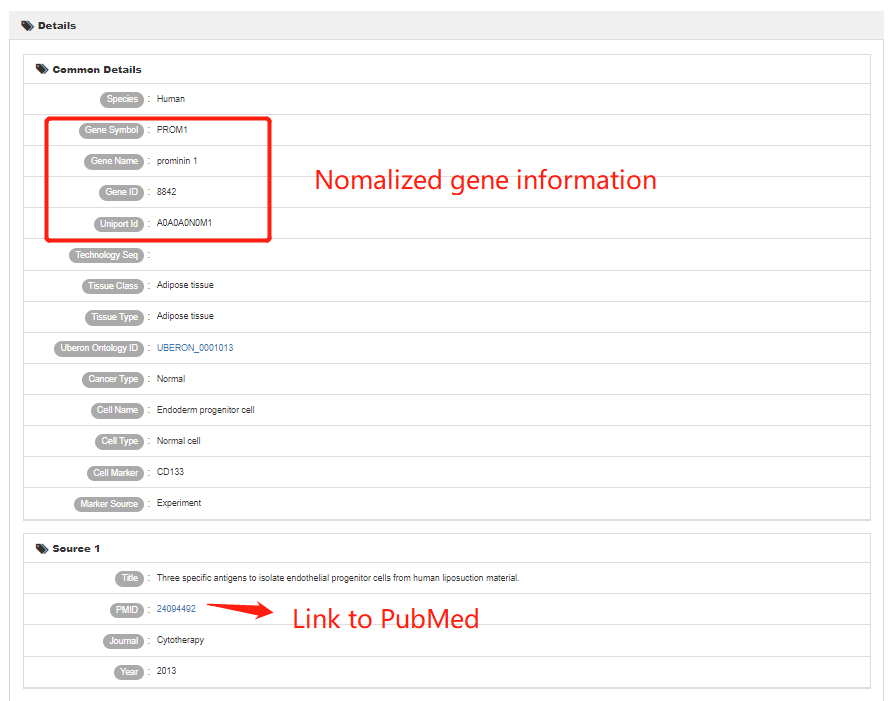
 Details help
Details interface provides detailed information on each deposited entry of cell markers, which contains comprehensive information of each single record in the entry.
Users can also use “Quick search” in the “Search” section.
Details helpDetails interface provides detailed information on each deposited entry of cell markers, which contains comprehensive information of each single record in the entry.
Browse help
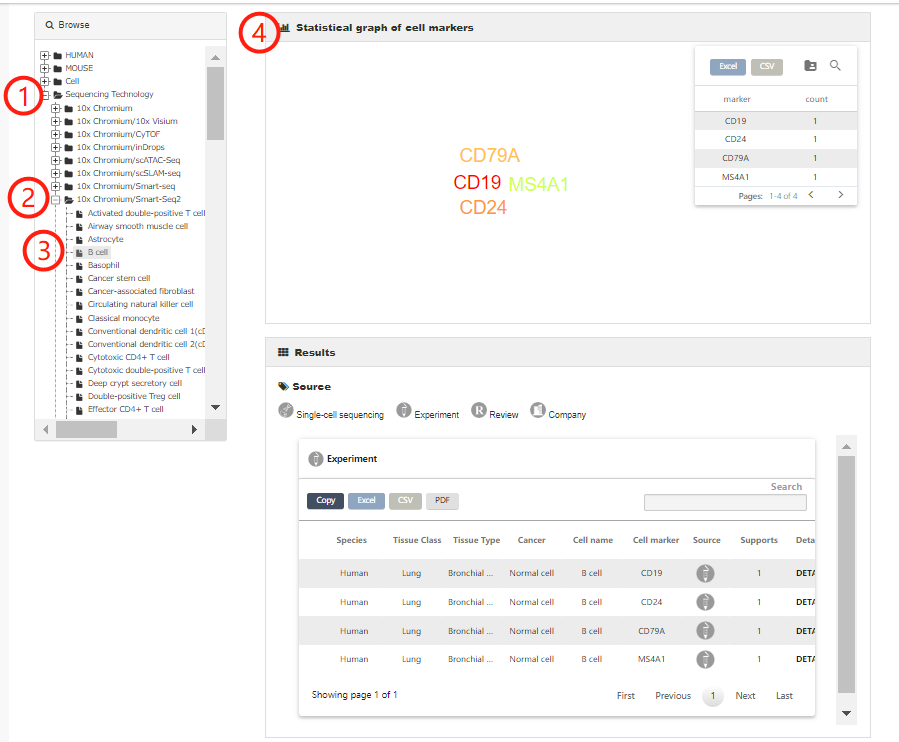
The browse page presents a hierarchical classification of cells and tissues. Users can browse cell markers by clicking cell types in different tissues of human (or mouse), and the complete list of matched cell marker entries can be returned (1-4). For example, to browse the entries related to Adipose tissue in human, you can click 'Human', choose the 'Adipose tissue' (2) and find the interested cell type, such as 'Adipose-derived stem cell' (3). The related cell markers will be shown on the right panel, including a statistical graph of the cell markers for the cell type and the entries from different sources (4).
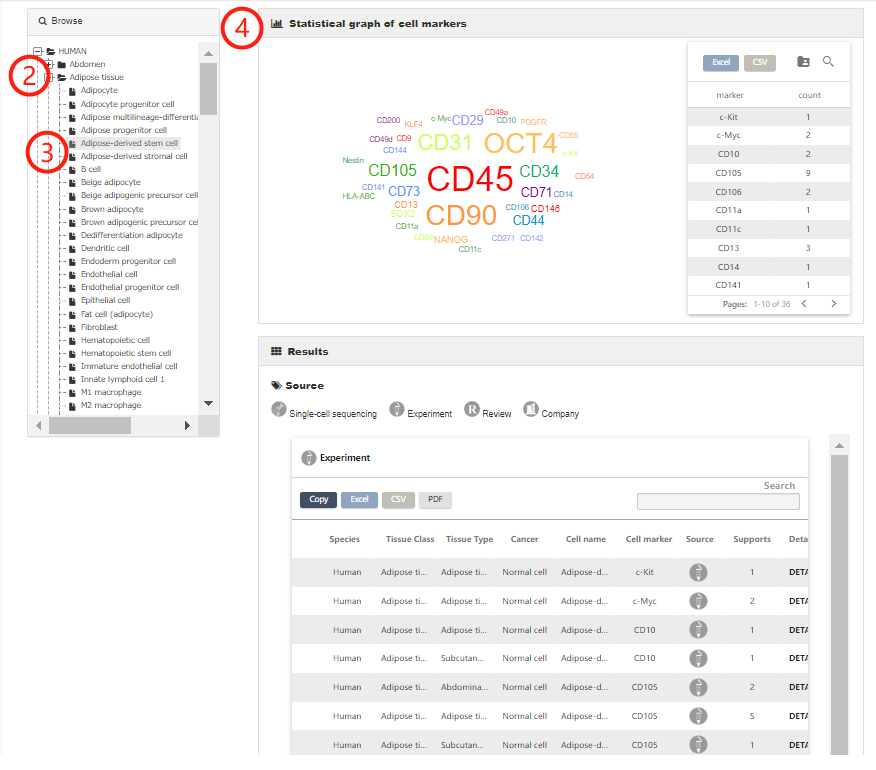
Users can also browse all entries associated with an interested cell type by directly selecting the corresponding cell (1-3).

Cell marker entries derived from Sequencing technology are listed separately on the bottom of the browse list (1-4).
Download help
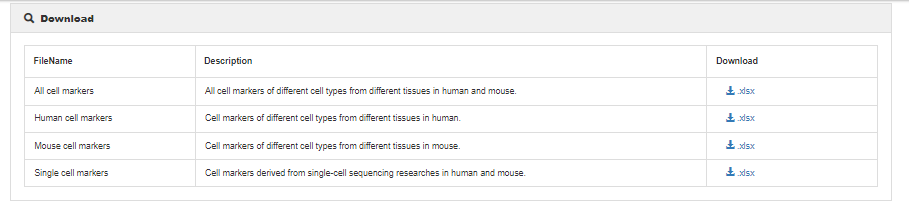
To download data in the database, select the menu 'Download'. CellMarker2.0 database provides downloadable file in XLSX format. Users can download all cell marker data sets, which include four files: (1) all cell markers of different cell types from different tissues in human and mouse, (2) cell markers in human, (3) cell markers in mouse, and (4) Cell marker from all sequencing technologies researches.
Cell Tool help
Users can perform single-cell analysis in CellMarker2.0 based on the provided single cell datasetusing cell annotation, cell clustering, cell differentiation,cell malignancy, cell feature and cell communication.
Cell Annotation help
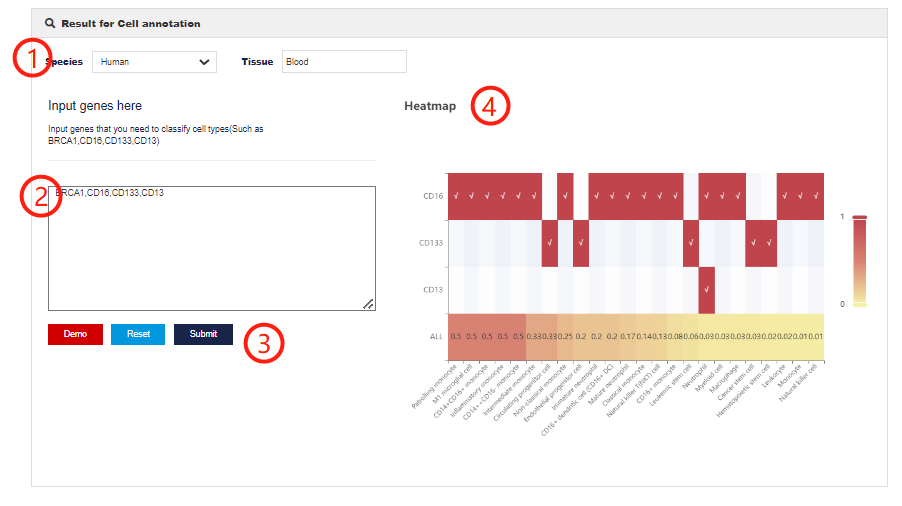
The cell annotation module allows users to define cell types by selecting species, tissues and input genes based on marker information stored in CellMarker 2.0.
1.Click to select species and tissue type.
2.Enter genes in the query box to match marker information.
3.Click on the submit.
4.The heatmap shows which cell type markers the input gene appears in and these cell type scores. The score is calculated according to the following formula.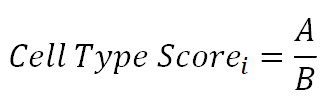 Where A represents the intersection number of input genes with marker genes in cell type i, and B represents the total number of markers in cell type iCell Type Scorei can reflect the proportion of user input genes in cell type i.
Cell Annotation help
The cell annotation module allows users to define cell types by selecting species, tissues and input genes based on marker information stored in CellMarker 2.0.
1.Click to select species and tissue type.
2.Enter genes in the query box to match marker information.
3.Click on the submit.
4.The heatmap shows which cell type markers the input gene appears in and these cell type scores. The score is calculated according to the following formula.
Where A represents the intersection number of input genes with marker genes in cell type i, and B represents the total number of markers in cell type iCell Type Scorei can reflect the proportion of user input genes in cell type i.
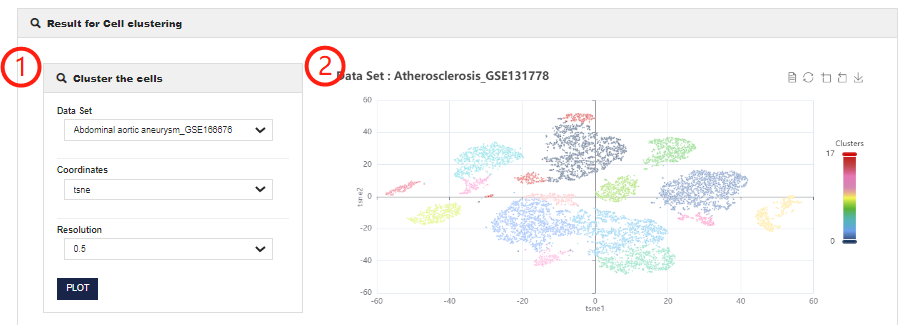
Cell Clustering help
Cell clustering module allows users to perform cluster analysis on single-cell transcriptome data and to obtain differentially expressed gene between different clusters.
1.CellMarker 2.0 allows users to customize chart parameters to get the best results after analyzing single-cell datasets. You can set different resolutions and coordinates (including tSNE and UMAP).
2.Visualization of Cell Clustering analysis results, presenting the results of different classifications of this dataset.
3.CellMarker 2.0 allows users to select different clusters for differential expression analysis.

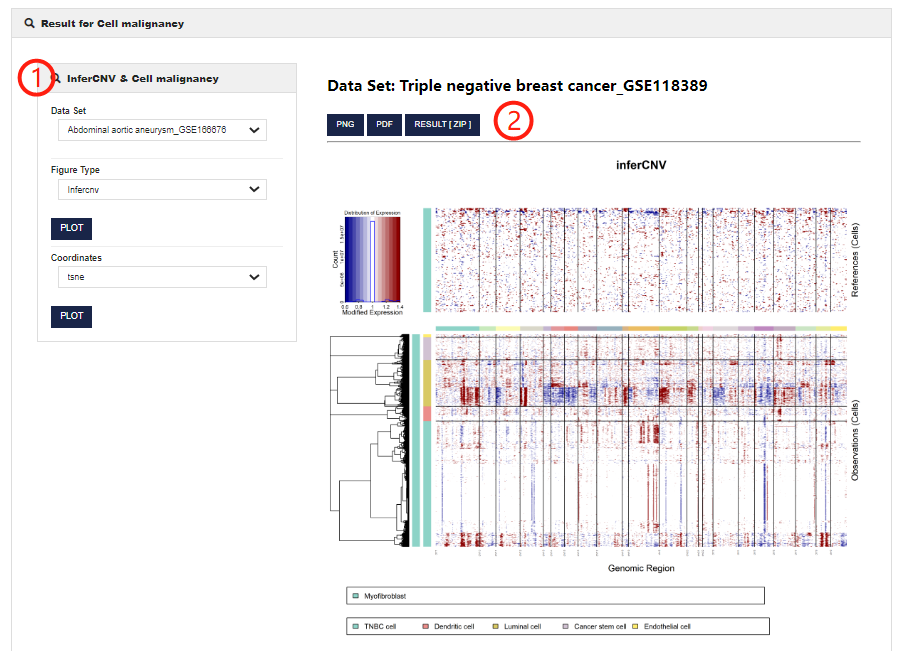
Cell malignancy help
Cell malignancy allows users to obtain the copy number variation of malignant cells in different datasets.
1.CellMarker 2.0 allows users to customize parameters to get copy number variation of cells in different single cell datasets. You can set different figure type.
2.You can view the results in PNG or PDF format and download the analysis results.
3.CellMarker 2.0 also allows users to select coordinates (including tSNE and UMAP) to visualize malignant and non-malignant cells.

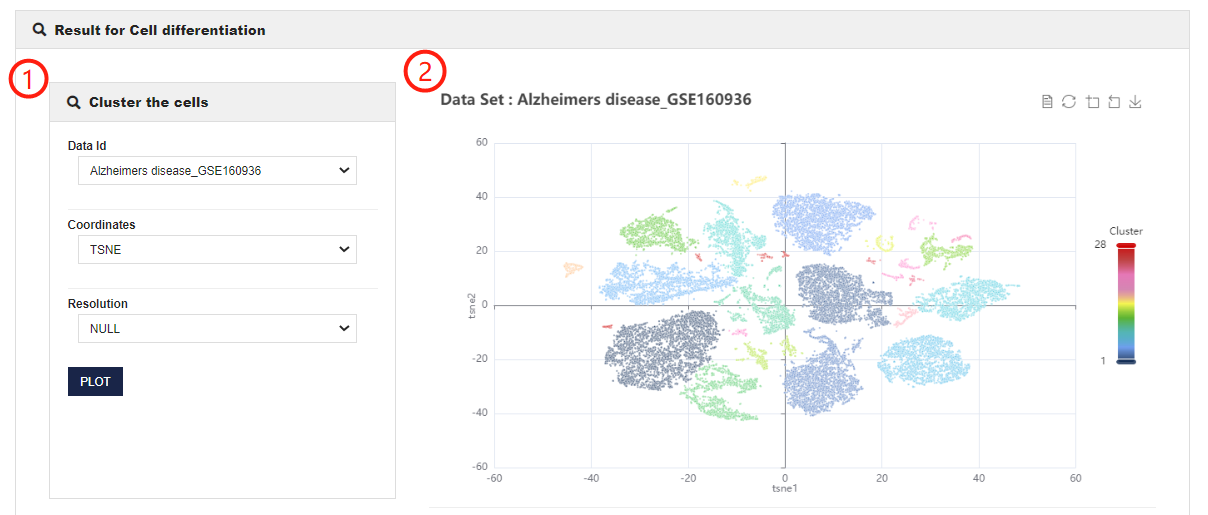
Cell differentiation help
Cell differentiation allows users to obtain cell differentiation trajectories of different datasets and the expression changes of interesting genes over time.
1.CellMarker 2.0 allows users to customize parameters to analyze the pseudotime trajectory of the cells. You can set different coordinates (including tSNE and UMAP), resolutions or root cluster, and input gene symbol.
2.Visualization of Cell differentiation analysis results (including presenting the results of different classifications of this dataset and showing pseudotime of cells and changes in gene expression over time).


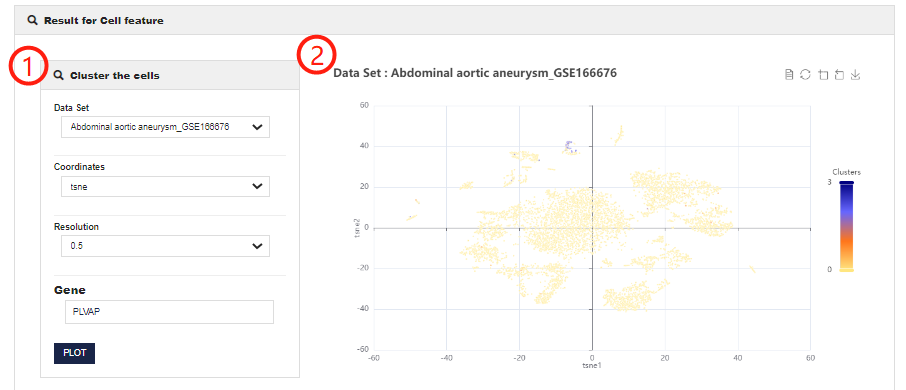
Cell feature help
The Cell feature allows users to obtain the expression of feature genes in different clusters.
1.CellMarker 2.0 allows users to customize chart parameters to get the best results after analyzing single-cell dataset. You can set different resolutions or coordinates (including tSNE and UMAP) and input gene symbol.
2.Visualization of Cell feature analysis results (including presenting the results of different classifications of this dataset and showing the expression of feature genes in different clusters)
3.CellMarker 2.0 allows users to select different clusters for differential expression analysis.


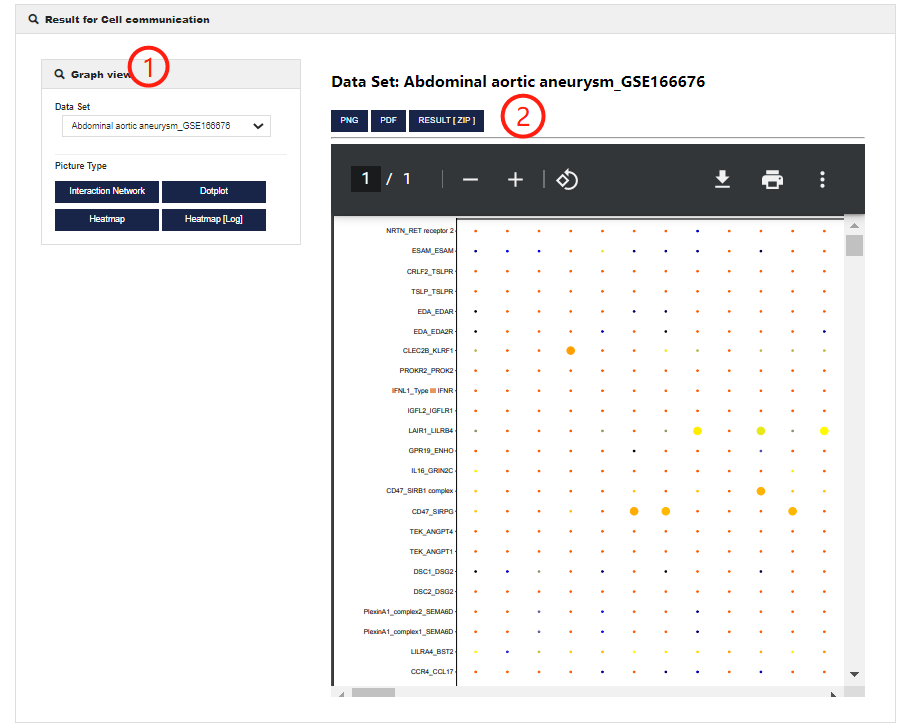
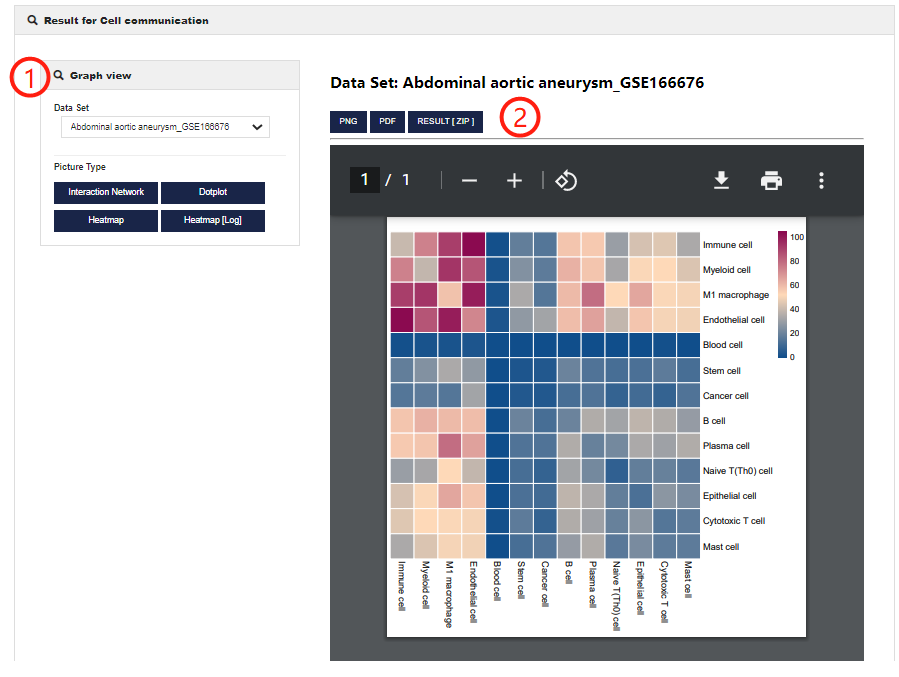
Cell communication help
Cell communication allows users to perform cell-cell interaction analysis. 1.CellMarker 2.0 allows users to customize parameters to get cell-cell interaction in different single cell datasets. You can set different figure type.
2.Visualization of Cell communication analysis results (including Cell-to-cell interactions, average ligand-receptor expression and ligand-receptor number).